Getting data from ESIOS
The first stop to analize the Spanish electricity market; with R and Rstudio.

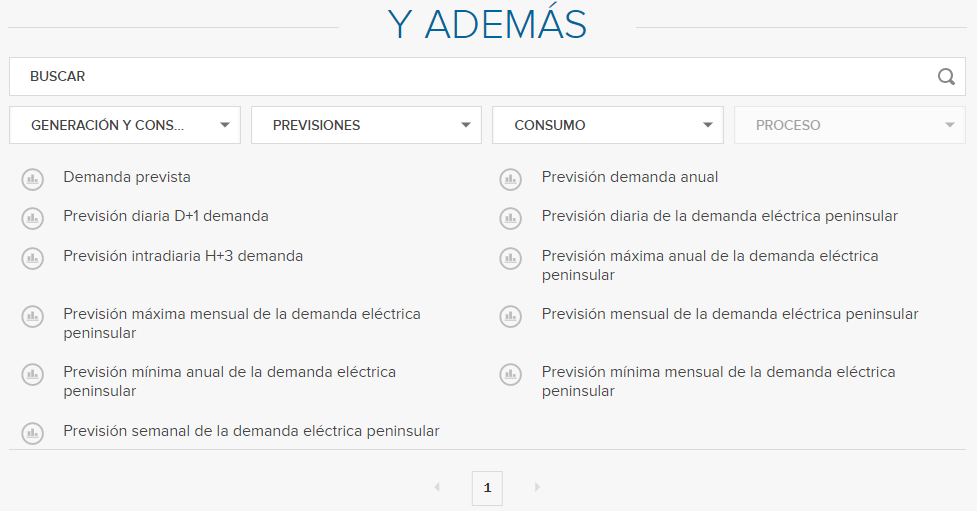
What is ESIOS?
ESIOS stands for “Sistema de Información del Operador del Sistema” which in English might be translated as the Information System of the System Operator.
This system has been developed by Red Electrica, which is the Spanish Electricity Transport System Operator (TSO), with the goals to:
Communicate with the Iberian Market Operator (OMIE)
Communicate with the participants of the Spanish electricity market.
Communicate with Spanish System Operator.
Communicate with the operators of electricity market systems in neighboring countries.
Publish the results of the different markets and schedules.
Take care of the interruptibility service.
Store the electricity market system information.
In this post I’m going to share the utility function that I routinely use to connect to the ESIOS API, and download data related to the Spanish electricity market.
For this purpose, I will use R and Rstudio along with some packages publicly available.
Getting you token
There is some input data needed to connect to ESIOS. The most important one is the user token which could be directly requested at consultasios@ree.es. You may also check the official API documentation for further information.
Your token should look something like:
8512rre6360e7e582c8fe75529b08e3ea74a280843b5c56c2c766c6505fad403In order to retrieve the data from the API, I will store and format my proxy token as follows:
token_esios <- 'Token token="8512rre6360e7e582c8fe75529b08e3ea74a280843b5c56c2c766c6505fad403"'Setting your indicators
Indicators are also needed to detail the API the data you want to get. Now, I’m going to bring in just two of them, but you can certainly expand your menu.
pred_ind <- c('electricity_prices', 600,
                'wind_generation', 1159)
If you wonder how to get the API indicators, I encourage you to browse the web of ESIOS and pay attention to the url changes. For instance, if you follow the link below you’ll see the wind generation data for Spain given by the indicator 1159 right after the last slash.
https://www.esios.ree.es/es/analisis/1159?vis=1&start_date=01-05-2022T00%3A00&end_date=06-07-2022T23%3A55&compare_start_date=30-04-2022T00%3A00&groupby=hour
You may be thinking how about downloading the list with all the indicators and then cherry pick the ones of your liking. After trying it and checking the swarm of indicators at ESIOS I suggest you not doing so.
I’d rather reccomend you embracing the search engine at the bottom of any indicator page from the browser, and listing down the ones you need.
Loading some packages for later use
library(dplyr)
library(lubridate)
library(jsonlite)
library(httr)
library(anytime)
library(zoo)
I also suggest you split the indicator data into two vectors: one with the indicator name and the other with the indictor itself, as a number.
file_name <- c(pred_ind[index(pred_ind) %% 2 != 0])
ind <- c(pred_ind[index(pred_ind) %% 2 == 0]) %>% as.numeric()
The utility function to retrieve data from the API
Now, you can define the following function to retrieve data from the input indicators. Have into account that you need to set a start date and end date for the function to work. You will be also retrieving data aggregated by geo, and truncated by day. You might change these paremeters or include them as an function input according to your needs.
ESIOS_retrieval <- function(ind, start_date, end_date, file_name, token_esios) {
  url <- paste0("https://api.esios.ree.es/indicators/",
                ind,
                "?start_date=",
                start_date,
                "T00:00:00+02:00&end_date=",
                end_date,
                "T23:50:00+02:00",
                "&geo_agg=sum",
                "&geo_ids[]",
                "&time_trunc=day",
                "&time_agg=avg",
                "&locale=es")

  get_request <- GET(url,
                     add_headers(Authorization = token_esios))

  jsonRespText <- content(get_request, as="text")
  data <- fromJSON(jsonRespText)
  data <- data$indicator$values
  dataframe <<- data
}
Looping the retrieval
You can set a for loop to retrieve the data from all your indicators one after another, naming the output dataframes with the indicator name and extraction dates.
for (i in 1:length(file_name)) {
ESIOS_retrieval(ind = ind[i],
start_date = start_date,
end_date = end_date,
file_name = file_name[i],
token_esios = token_esios)
assign(paste0(file_name[i], "_", start_date, "_", end_date), dataframe)
print(paste0('Retrieved data for indicator name: ', file_name[i]))
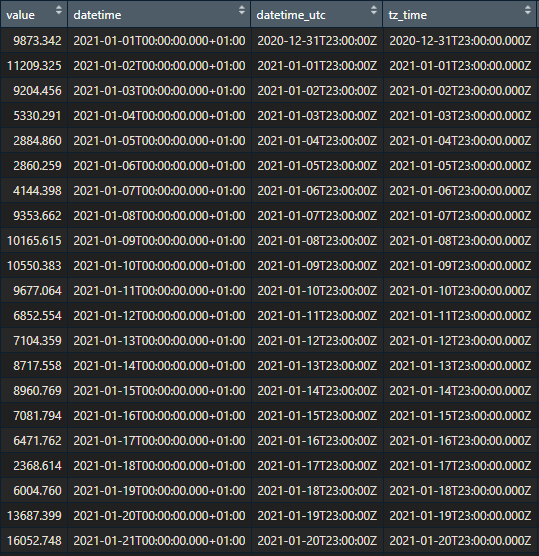
}As you may see, the output data contains the value of the indicator (whose units might be checked reviewing the indicator info from the browser), dates, and geos.
So that should be for today.
If you are interested in knowing more about retrieving energy-related data and what to do with it, subscribe to this content.
You may also drop me a line at datadventures@substack.com, if you have something worth talking.