Tracking and visualizing app rankings by number of Keywords in Google Play over time
How to chart app rankings by number of Keywords using R, and ggplot2.

In this thrid part of this ASO series, I´m going to share how to display a compelling charts showing the number of selected Keywords a given app is ranking over time.
Loading and wrangling apps and Keywords data
The first step would be to load the daily Keyword searches data already retreived as detailed in the first part of this ASO series.
The second step would be to rbind your daily Keyword searches into a dataframe including the Title (app_name), the Keyword_search, Ranking , and Date (retrieval_date).
You may need to use your app profile retrieved data (second part of this series) to match the app_name with the app_id present in your Keyword searches data.
Eventually, you may filter by the app_name you’d like to track. Here it goes an example of the output for the app ‘Calisteniapp - Streetworkout’.
df_rank_all %>% head(20)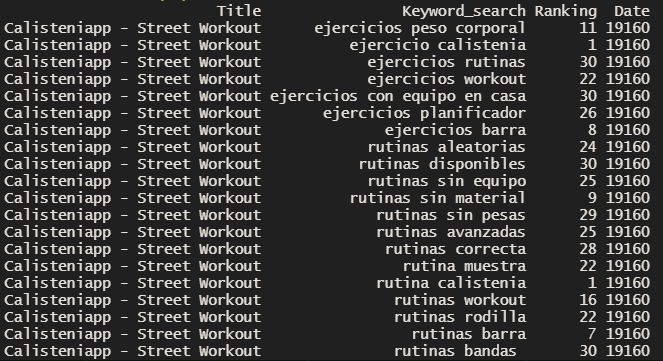
Building the Keyword charts with ggplot2
Now it´s time to make some fancy plots. I suggest you working with ggplot2 and directlabels R libraries. My current settings are the following:
library(ggplot2)
library(directlabels)
KW_search_rank_for_app <- df_rank_all %>%
ggplot(aes(x=anydate(Date), y=Ranking, color = Keyword_search)) +
geom_line() +
geom_point() +
scale_colour_discrete(guide = 'none') +
scale_y_continuous(trans = 'reverse',
limits = c(max(df_rank_all$Ranking)+3,min(df_rank_all$Ranking)-3),
breaks = unique(df_rank_all$Ranking)) +
scale_x_date(limits = c(anydate(short_date), anydate(end_date)+1)) +
geom_dl(aes(label= Keyword_search, colour= Keyword_search),
method = list(dl.trans(x = x + 0.2), 'last.bumpup', cex = 0.8)) +
theme_bw() +
ylab(NULL) +
xlab(NULL) +
labs(title= paste0('Detailed KW rankings on the Google Store for: ', df_rank_all$Title[1]))
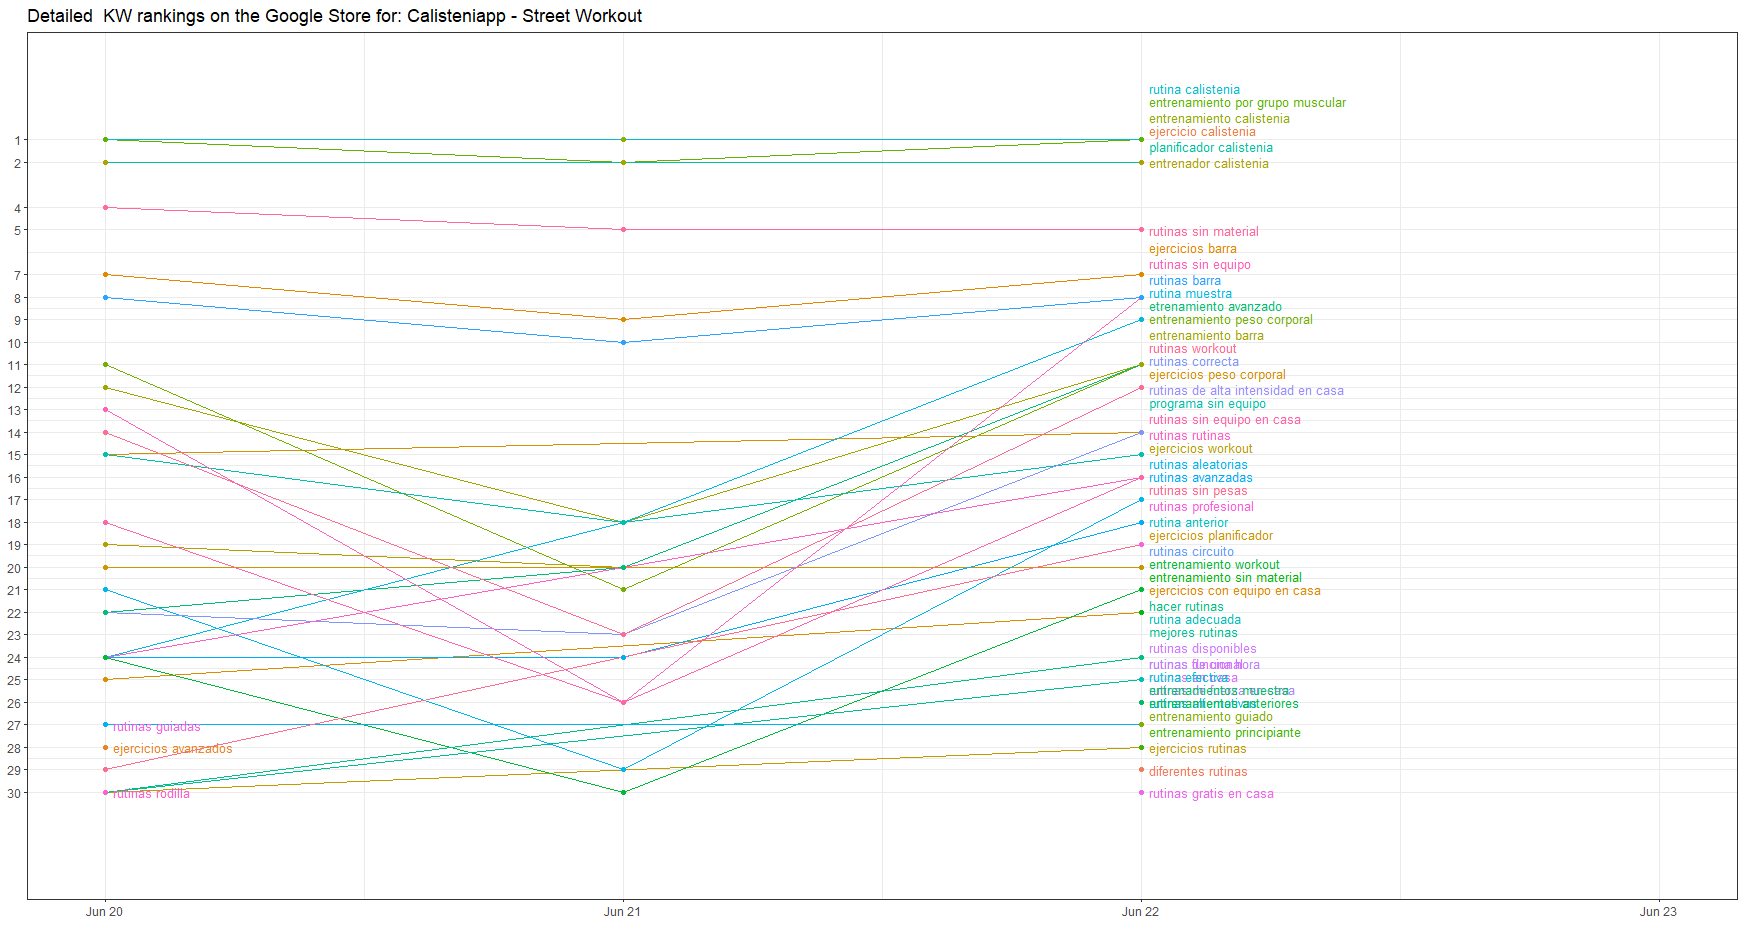
KW_search_rank_for_app Which outputs the following chart displaying how ‘Calisteniapp - Streetworkout’ ranked for the localized-in-Spain Keyword search shown to the left (and for which this app was listed within the Top30 of Google Play, by date).
Have into account that my short_date it is just two days prior to the end_date because my aim with this chart is to display the short-time Keyword dancing and for the sake of cleaness in the chart. You may modify these paremeters based on your interests.
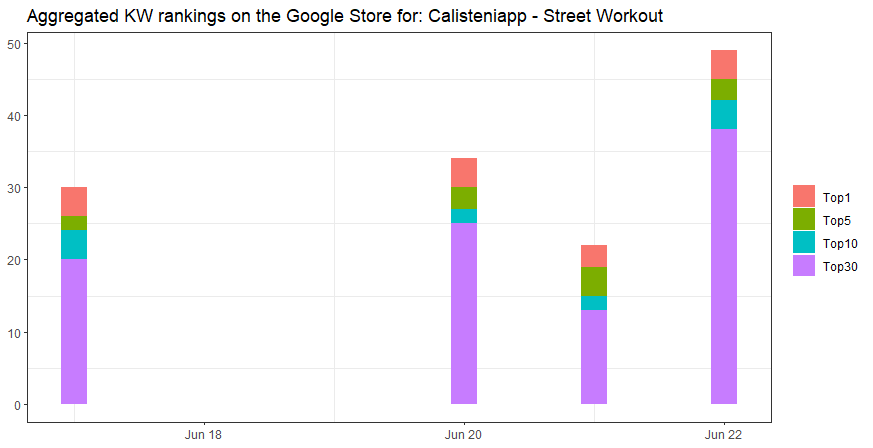
You may also want to analyze how many Keywords a given app is ranking for over time. It would also be insightful to know for how many of those Keywords a given app is ranking in the Top1, Top5, Top10, or the Top30 of Google Play over time.
This scope is achieved by this piece of code.
library(dplyr)

KW_rank_long_time <- df_rank_all %>%
  group_by(Date) %>%
  summarise(
    Top1 = sum(Ranking == 1),
    Top5 = sum(Ranking > 1 & Ranking < 6),
    Top10 = sum(Ranking > 5 & Ranking < 11),
    Top30 = sum(Ranking > 10 & Ranking < 31)
    )  %>%
  gather('Position', 'Cases', 2:5)  %>%
  ggplot(aes(x=anydate(Date), y=Cases, fill = factor(Position, levels=c("Top1","Top5","Top10", "Top30")))) +
  geom_bar(position="stack", width = .2, stat="identity") +
  theme_bw() +
  theme(panel.grid.major = element_blank()) +
  theme(legend.title = element_blank()) +
  ylab(NULL) +
  xlab(NULL) +
  labs(title= paste0('Aggregated KW rankings on the Google Store for: ',
                     df_rank$Title[!is.na(df_rank$Title)][1]
                     ))
KW_rank_long_time
Which outputs the following. Have into account that there are some missing days from the original seven days since I lacked the Keyword ranking data at this time.
And that´s it for today.
In my next entry I will make an ASO case about the scoring of Keywords to improve an app rankings on Google Play.
Stay tuned and subscribe for more content of this kind.
Should you have any comment or request, do not hesitate to get in contact with me by email at datadventures@substack.com