Reporting app Keyword rankings and scorings from Google Play using R and a Telegram Bot
How to automate your daily ASO insights reporting with Telegram.

This is the fifth entry of my ASO series and it will focused on developing a convenient reporting tool to track your app and keywords positioning and scorings in Google Play, on a daily basis.
Why a telegram bot
Before stepping into Telegram, I admit that I was used to work with emails for reporting. However, I didn´t like the experience due to the amount of emails I receive and other storing issues of my inbox.
For this reason, I decided to switch the reporting towards a Telegram bot posting insights in a dedicated chat group for my personal Google Play ASO insights.
As for the materials shared, I´m used to check three items every day:
Evolution of each localized app Keywords ranked in the Top30, over the last 3 days (AKA Keyword dancing chart).
Amount of localized app Keywords ranking in the Top30, Top10, Top5 and Top1, over the last 7 days (AKA app Keyword positioning)
Tracked and used Keyword scorings and auto-reccomendations for Keyword pair replacements, sorted by importance.
Previous work
If you are interested in know more about how to obtain these charts and tables, you may check my former articles in this ASO series.
Tracking and visualizing app rankings by number of Keywords in Google Play over time.
Improving app positioning in Google Play using Keyword scorings.
Sending messages, pictures and links with a telegram bot
Coding wise, the implementation is very straightforward. I won´t get into the intricancies of setting up your telegram bot token, chat id, etc. I can nontheless assure you that it is not difficult at all, and you´d be good to go in no more than 30 minutes following this telegram.bot package tutorial.
library(telegram.bot)
library(ggplot2)
library(gridExtra)
# Initiate the bot session using the token from the environment variable.
bot = Bot(token = bot_token('your_bot'))
# Chat ids to distribute the reports. You may add more if needed.
chat_id <- c('your_chat_id')
# Filtered dataframe with the KW scorings and replacement proposals.
df <- KW_used[!is.na(KW_used$KW_exchange_proposal), c('Keyword_search', 'Full_score', 'KW_exchange_proposal', 'KW_proposal_score', 'KW_exchange_score_diff')]
setwd("/your_root/to_save/chart_images_to_share/")
png("aux_plot0.png", height = 30*nrow(df), width = 140*ncol(df))
grid.table(df)
dev.off()
ggplot2::ggsave("aux_plot1.png", KW_rank_long_time, width = 10, height = 6)
ggplot2::ggsave("KW_evolution/aux_plot2.png", KW_search_rank_for_app, width = 8,
height = min(round((max(df_rank_all$Ranking) - min(df_rank_all$Ranking) + 1)*15/50,0), 49.9))
# Bot loop sending messages through the different chat ids.
for (i in 1:length(chat_id)){
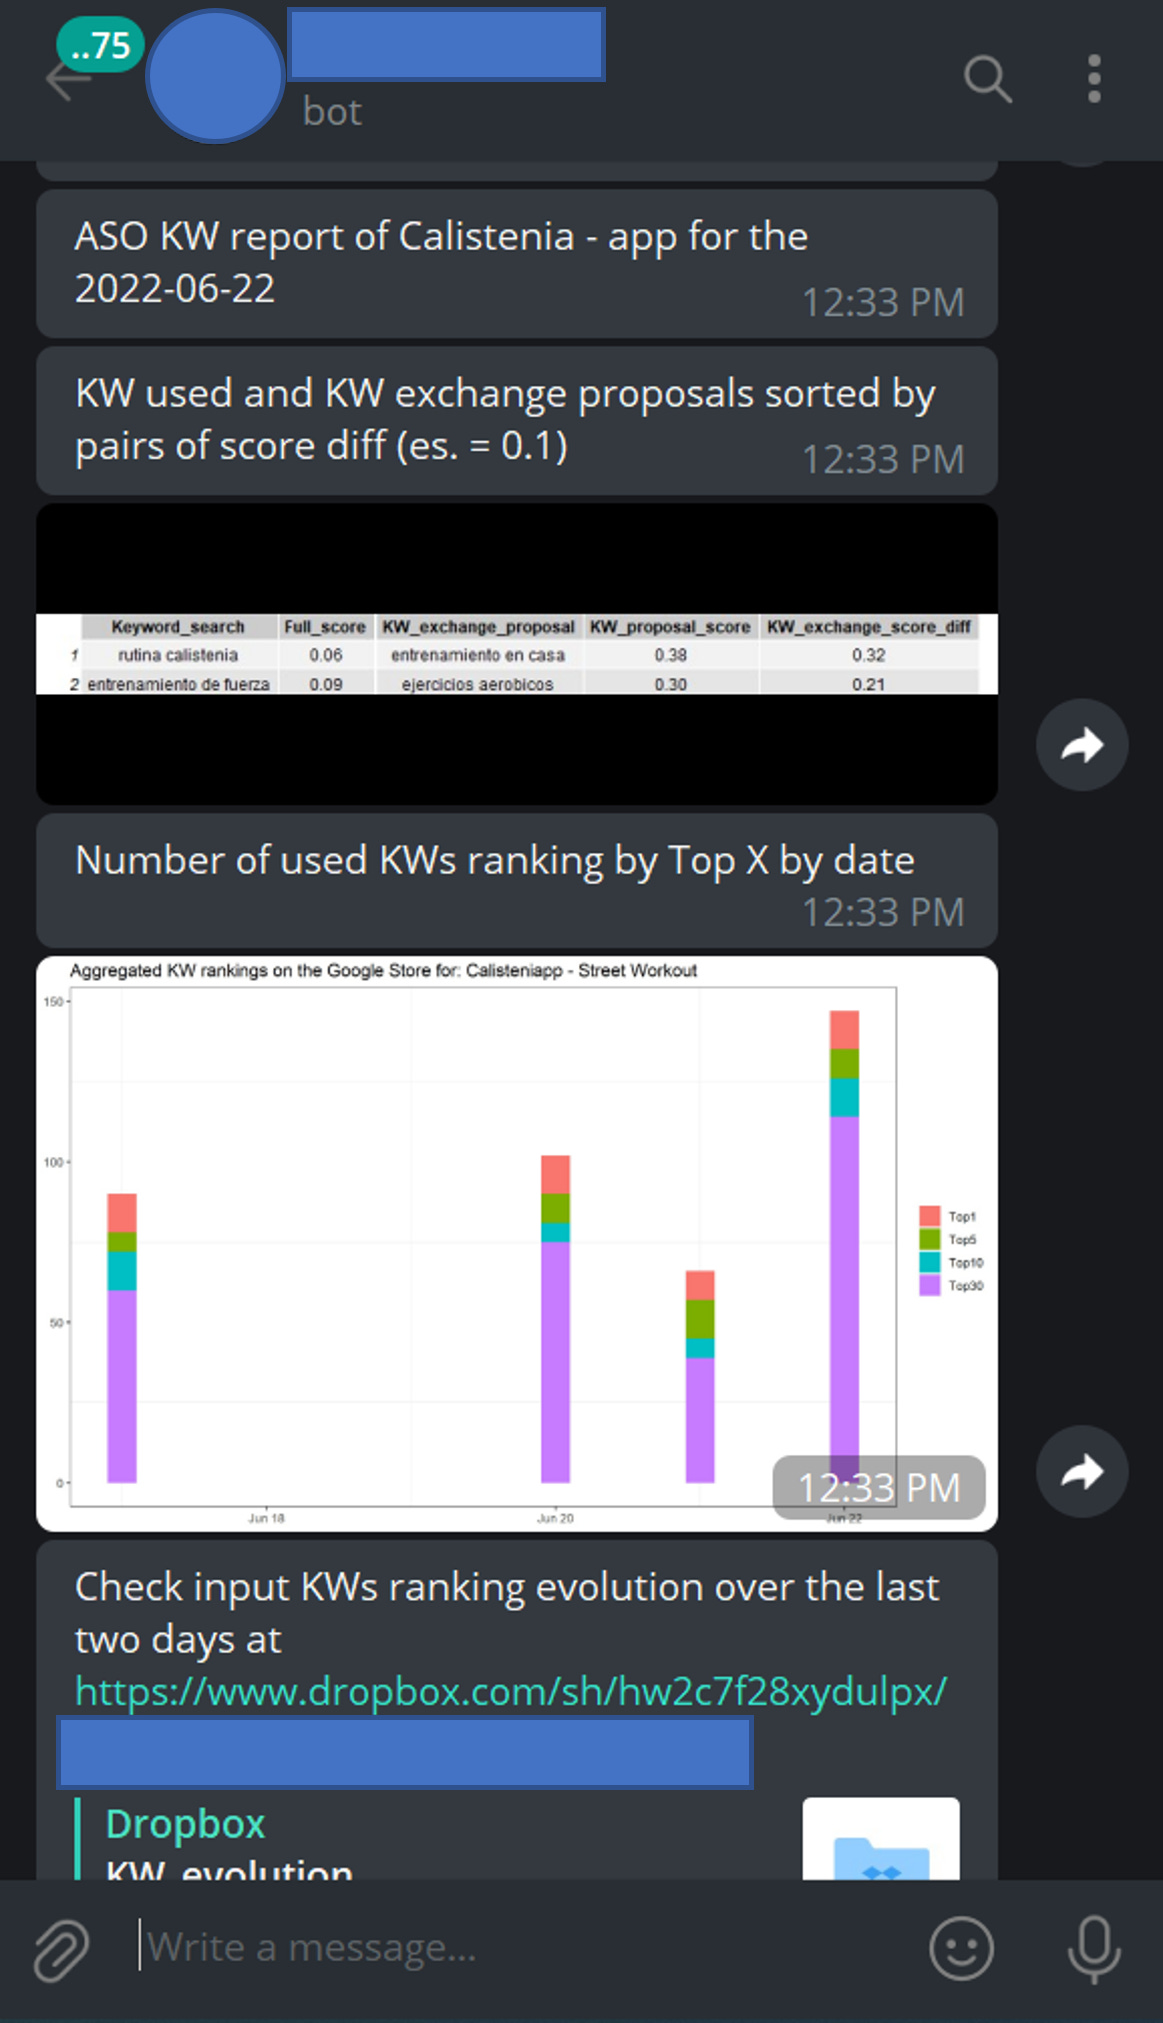
bot$sendMessage(chat_id[i], text = paste0('ASO KW report of app_name app for the ',
anydate(end_date)))
bot$sendMessage(chat_id[i], text = 'KW used and KW exchange proposals sorted by pairs of score diff (es. = 0.1)')
bot$sendPhoto(chat_id[i], photo = 'aux_plot0.png')
bot$sendMessage(chat_id[i], text = 'Number of used KWs ranking by Top X by date')
bot$sendPhoto(chat_id[i], photo = 'aux_plot1.png')
bot$sendMessage(chat_id[i], text = 'Check input KWs ranking evolution over the last two days at https://www.dropbox.com/_the_rest of_your_dropbox_link')
}Take into account that in the last case, I’m sharing a dropbox link pointing to the folder where the KW dancing chart picture is saved due to problems with the size and resolution image output with ggplot2 and Telegram.
You may not need to share any links and just paste the charts on your Telegram ASO reporting chat group.
The final results on Telegram looks as follows:
So this would be it for today.
If you´d like to know more about how to schedule your R scripts to report the ASO charts and tables described above on a daily basis stay tuned since I will write about that in the next article of this ASO series.
Should you have any comment or request, do not hesitate to get in contact with me by email at datadventures@substack.com